Charts serve to organize and summarize what we know. They can also be a ready reference when we cannot keep things straight in our head. I have quite a few relatives to whom I am related in more than one way. That can compound challenges when working with autosomal DNA test results as the shared double connections (at least for me) are often 5th great-grandparents or closer.
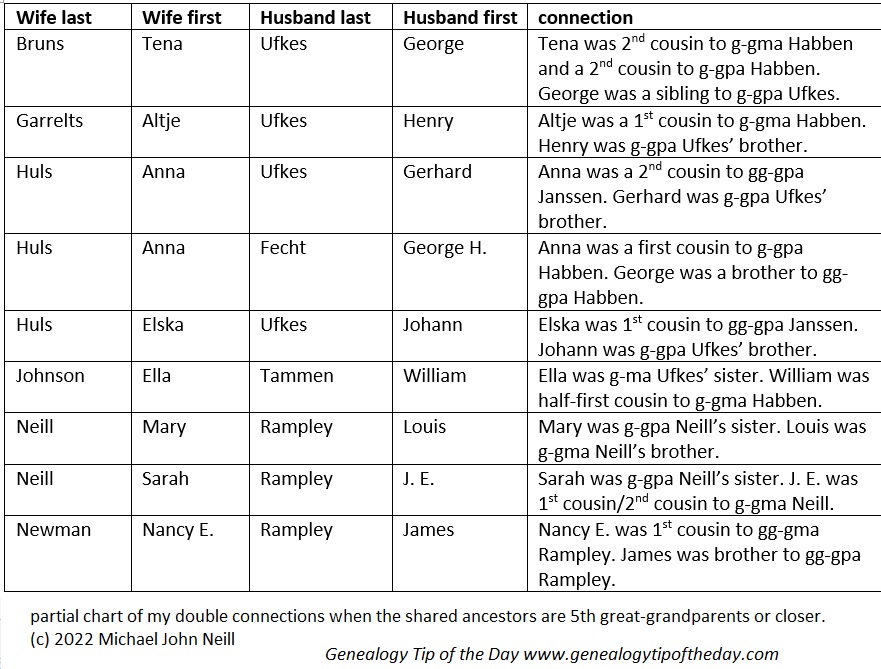
These double connections can impact the amount of shared DNA we have (not necessarily doubling it at all). It can also impact the shared matches. Some of the double relationships I have in my head, but it’s impossible to keep them all at the ready mental reference.
So I made a chart. The relationship is not completely stated, but there’s enough detail in the chart so that I know what couples I have double connections with and a general idea of how both the wife and husband are related. I can refer to additional information if necessary. The chart just serves as a quick way to know if both the husband and wife in a couple are related to me.
The illustration is just a partial list.
Help support Genealogy Tip of the Day by visiting any of the following sites:
- Try a GenealogyBank Genealogy Search to see what you find.
- Newspapers.com
- AncestryDNA offers.
- Books on Michael’s Genealogy Shelf
- My webinars
- My 1950 Census prep webinar


No responses yet